Debugging in ServiceNow – What Really Happens Behind the Scenes When Things Break
If you’ve spent enough time working with ServiceNow, you know that there’s only one thing that’s for sure: things break. Not always in a spectacular fashion, but in little ways that just leave you scratching your head and questioning everything that just got built.
- A field doesn’t update.
- A business rule fires at the wrong time.
- A workflow just flat-out stops working for no reason.
And the worst part is that sometimes it looks like everything is perfectly fine.
This is where debugging comes in – not so much as a toolset, but more like a frame of mind that you cultivate after working with the platform for a while. It’s not so much about the toolset as it is about how the platform behaves when things go sideways.
Why Debugging Feels Difficult at First
When you start working in ServiceNow, you usually start with building things: forms, flows, scripts, UI policies, etc. Debugging is not something that you actively learn in the first place; you just start doing it when something goes wrong.
The problem is that ServiceNow is not a one-level system; a single action might trigger:
- Client scripts
- UI policies
- Business rules
- Script includes
- Flow Designer actions
- ACL checks
And all these things might be executed simultaneously; sometimes in a specific order, sometimes in a specific way, depending on the conditions that you might have set but forgot about.
And so when something doesn’t work, you might not know exactly where the problem is.
The First Lesson: Don’t Guess, Observe
One of the major mistakes that beginners make is that when something doesn’t work, they immediately start trying to fix the issue without really understanding what’s going on.
You need to take a step back and observe:
- What’s exactly not working?
- When exactly is the issue occurring?
- Is the issue occurring for all users or just for one user?
- Is the issue occurring in a specific way or in a random way?
These little questions can save a lot of time. Debugging will be much easier if you don’t have to guess anymore.
Understanding the Execution Order Changes Everything
If there’s one thing that can significantly improve your debugging skills right away, it’s understanding the execution order.
For example, when a form is submitted:
- Client scripts execute first
- Then UI policies
- Then server-side
- Then the business rules
- And maybe some flow/workflow afterwards
If you don’t know this order, you’re basically debugging by guesswork.
Let’s say a field’s value is changing unexpectedly.
You might think a client script is causing it, but what if a business rule executed afterwards, changing the record’s value?
That’s why experienced developers don’t just care about what’s happening. They care about when what’s happening is happening.
The Power of Logs (Even Though They Feel Basic)
There is a time in everyone’s life when they learn that, no matter how they feel, logs are a must.
With basic log statements such as:
- gs.info(“Reached here”);
You might think you are doing something very basic, but you are actually learning something very important: whether or not your script is running.
You might also want to try:
- gs.warn()
- gs.error()
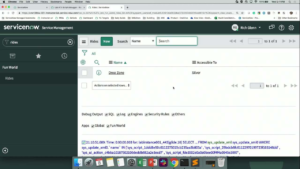
And then check everything in System Logs > All.
It is basic, but it is very useful, and most debugging starts with this.
Script Debugger: Good, But Usually Not Used to Its Full Potential
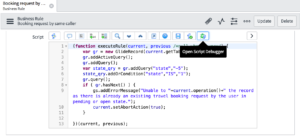
ServiceNow offers a script debugger, and while it is a very useful tool, most people avoid using it because they think it is a little slow or a little complicated.
But if you use it, you will see that it is extremely useful.
With this, you can:
- Pause execution
- Step through your script
- See exactly where you go wrong
- Understand exactly what is happening in your script
But you have to be patient with this one, because you don’t speed through it. You let your script run and see exactly what is happening.
Client Side Debugging – A Different Game
Server-side debugging is one thing, but when it comes to client-side issues, it’s a different ball game.
In this case, your best bet is:
- Browser Console (Inspect > Console)
- console.log statements
- Debugging UI Policies and Client Scripts
The issue, in this case, is not necessarily in your code, but it could be:
- A conflicting client script
- A UI policy overrides your code
- A missing condition
The problem, in this case, is that there are other scripts that run at the same time, and they are all targeting the same field.
Business Rules – The Silent Troublemakers
If something is not behaving as it should after saving a record, then it is likely that a business rule is at play.
The common issues that arise include:
- Incorrect timing of execution (before or after)
- Conditions not being set correctly
- Scripts running on update rather than insert
- Multiple business rules are being applied to a single field
A good idea is to disable business rules temporarily, one at a time, to try to solve the issue. It’s not necessarily the fastest way to debug, but it is effective.
Debugging Flows and Workflows
Flow Designer makes everything look simple, but sometimes it can be frustrating to debug your flows.
Sometimes your flow may:
- Not trigger
- Not run to completion
- Skip some actions
But in these situations, checking the execution details can help:
- Open the flow execution
- Check each step
- Check where it failed or stopped
Unlike scripts, flows do not provide clear error messages, but you have to read between the lines a bit.
ACL Debugging: The Invisible Barrier
Sometimes your code may not be “broken,” but you may not have access.
And this is where ACL debugging comes in.
You may notice:
- Fields not being displayed
- Records not being accessible
- Actions not working
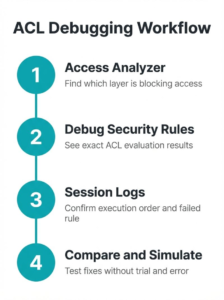
But Debug Security Rules can help you see:
- Which ACL is being evaluated
- Whether it succeeded or failed
- What denied access
Most bugs are due to permissions.
A Small Real-World Situation
I had a form that had a field that was resetting after saving the form. The form looked all right:
- Client script is all right
- UI policy is all right
- No error in logs
And after checking all these things, the problem was a business rule that executed after the insert operation and set the field back to its initial value.
It took me a while to identify this problem because nothing looked wrong.
This is what debugging is all about—it’s not always about fixing code; sometimes it’s about discovering things.
The Real Skill Behind Debugging
Debugging is not really about the tools; it’s about being able to think clearly.
You start to:
- Break down a problem into smaller pieces
- Check one level at a time
- Do not make assumptions
- Believe what the system is showing you
And eventually, things start to make more and more sense.
Final Thoughts
Debugging in ServiceNow isn’t something that you learn in a day. Debugging in ServiceNow is something that comes with experience, with failures, and with a lot of patience.
ServiceNow is a powerful platform. However, being powerful also means that it has a lot of moving parts. And when something goes wrong, it’s not always clear what to do. However, what to do is always clear when you take the time to properly debug.
At the end of the day, debugging teaches you much more than building ever will.
After all, once you learn what went wrong in the first place, it’s much harder to do it again.
And that’s where the real learning happens.