
ServiceNow Dashboards that Talk: Using Real-Time Data to Tell Tales
Information is only as valuable as the story it tells in the fast-paced, data-rich world of today. ServiceNow Dashboards are now more than just a “nice to have” in the business world; they are crucial instruments for strategic direction, visibility, and decision-making. The problem is that dashboards aren’t just about packing a screen full of widgets. They are about clearly and purposefully narrating a story in real time.
This blog discusses how to turn your ServiceNow dashboards into dynamic, intelligent stories that inspire action rather than merely observation.
-
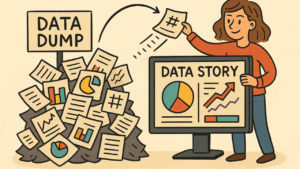
The Dashboard Mentality Transition: From Data Dump to Data Conversation
Dashboards are still often used by many organizations as a place to gather all metrics without any true organization or focus. The result? Visual overload.
Selecting the most important information and presenting it in a way that leads your audience from curiosity to understanding is where the true power is found.
A well-designed dashboard in ServiceNow answers:
1-What’s happening right now?
2-Why is it happening?
3-What action is needed?
This is the difference between a data wall and a data story.
-
Start With the “Why” (Not the Widgets) Before dragging charts onto a screen, take a step back and ask:
1-Who is the audience?
2-What decisions do they need to make?
3-What behavior do we want to influence?For instance, a dashboard for a Change Manager should focus on change volume, success/failure rate, emergency changes, and upcoming approvals—not random incident metrics.Your dashboard should feel like a daily briefing, not an encyclopedia.3. Use Real-Time Data to Drive Real-Time Decisions
One of ServiceNow’s greatest strengths is its real-time data engine. When dashboards are wired to live KPIs, you’re not just reviewing history—you’re responding to the now.
Examples:
1-An IT Operations dashboard showing current open P1s with breached SLAs.
2-Agents with the most calls today are highlighted on a service desk dashboard.
3-A dashboard for security incidents that displays current threats by impact zone.
Dashboards are transformed from passive observers into operational triggers by this immediacy.
-
Tell a Visual Story (But Keep It Simple) You’re not building art. You’re building clarity.
Here’s how to visually organize a story:
1-Summary (high-level KPIs) at the top of the dashboard
2-Middle = supporting trends (contextual charts)
3-Action items (lists, tables for in-depth analysis) are at the bottom.
Make use of readable fonts, consistent colors, and refrain from needlessly combining different chart types. A donut chart next to a stacked bar, next to a gauge, with no alignment—it’s a headache.
Also, name your widgets meaningfully. “The information presented in ‘Chart 1’ and ‘PA Graph 2’ is not helpful to anyone.” Use titles like “Weekly Change Success Rate” or “Open Incidents by Assignment Group”.
5. Make It Role-Based, Not One-Size-Fits-All
A ServiceNow dashboard should feel personal. Build role-specific dashboards:
1-CIO gets strategic insights.
2-Managers get operational views.
3-Agents get day-to-day task visibility.
Don’t show “all data” to everyone—it leads to confusion and clutter: leverage groups and ACLs to tailor dashboard content.
Bonus tip: Utilize interactive filters to allow users to refine by location, service, or priority without leaving the screen.
6. Build With Performance Analytics (PA) – Not Just Reports
If you’re still relying solely on saved reports in widgets, you’re missing the magic.
Performance Analytics (PA) lets you:
1-Create indicators (trends over time)
2-Set targets and thresholds
3-Show historic comparisons (week-over-week, month-over-month)
4-Forecast future values
Instead of “Open Incidents = 156”, you can now show:
“Open Incidents trend increasing 12% over the last 30 days”
That’s insight, not just data.
7. Use Periods to Show Progress, Not Just Status
Dashboards often focus solely on the present, displaying information such as “what’s currently open” or “what’s pending at the moment.” That’s fine—but add context.
For instance:
1-“Compared to last month, how many changes failed this month?”
2-“Is our backlog of incidents getting smaller every week?”
3-“Has the number of SLA violations decreased in the last quarter?”
Leaders can see progress rather than just issues thanks to these trends.
-
Develop a habit of using dashboards rather than a project
A dashboard is a living system rather than a one-time product.
Maintain it up to date:
1-Every quarter, review and eliminate any widgets that aren’t being used.
2-As business priorities change, add new KPIs.
3-To avoid dashboard blindness, rotate the charts.
Additionally, incorporate dashboards into everyday tasks:
1-Utilize during team standups.
2-Add links to messages in Teams or Slack.
3-Configure email digests using PA widgets.
Dashboards ought to be integrated into the workday rather than existing as a stand-alone portal.
-
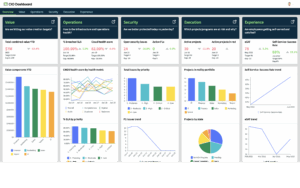
The Incident Management Dashboard is a real-world example.
This is how a successful incident management dashboard provides a narrative:
Top Row: Average Resolution Time, Total Open Incidents, and SLA Breach
Middle Row: Daily, category, and group trend of incidents
Bottom Row: P1/P2 table with upcoming update due
Users can view by shift, location, or impacted service using filters.
As a result, the Service Desk Lead can take prompt action, rearrange agents’ priorities, and escalate problems as needed.
-
Concluding Remarks: Give Your Data a Voice and Let It Speak Clearly
When done correctly, a ServiceNow dashboard does more than just show numbers. It
1-Describes the current situation.
2-Draws attention to opportunities and hazards.
3-Encourages prompt decision-making
4-Focuses teams on the important things.

Therefore, stop creating dashboards that are merely decorative. Create ones that can guide, warn, and speak. Dashboards that speak, to put it briefly.

No comment